How to Send ArcGIS Monitor Webhook Messages to MS Teams
The newest version of ArcGIS Monitor is available, with significant improvements to monitoring and alerting workflows. At dymaptic, we monitor multiple ArcGIS Server environments for our clients, and this integration has been a practical addition to that workflow. This post walks through one implementation: connecting those webhooks to Microsoft Teams using Microsoft Power Automate.
Quick Summary
- ArcGIS Monitor 2023.3 introduced webhook support for Collections, enabling automated alert notifications.
- This post walks through connecting ArcGIS Monitor webhooks to Microsoft Teams via Microsoft Power Automate.
- The integration uses a Power Automate Flow to filter, format, and deliver alert messages to a Teams channel.
- The configuration includes dynamic URL construction, a JSON metric lookup from a backend PostgreSQL database, and conditional threshold display.
What Is the ArcGIS Monitor 2023.3 Webhook Feature?
One of the new ArcGIS Monitor features is webhooks from Collections. I talked about creating Teams Webhooks in a previous blog post, but in this post we are going to discuss using the Monitor Webhooks. The integration connects ArcGIS Monitor alerts to Microsoft Teams messages via Power Automate.
How Do You Connect ArcGIS Monitor Webhooks to Microsoft Teams?
The first step is creating a collection. I am specifically interested in one particular ArcGIS Server as it gets the most use out of all the servers we maintain. The dymaptic team uses Power Automate to bridge ArcGIS Monitor alerts with Teams notifications. The collection will query for any component where the Internal Address is equal to the server URL.
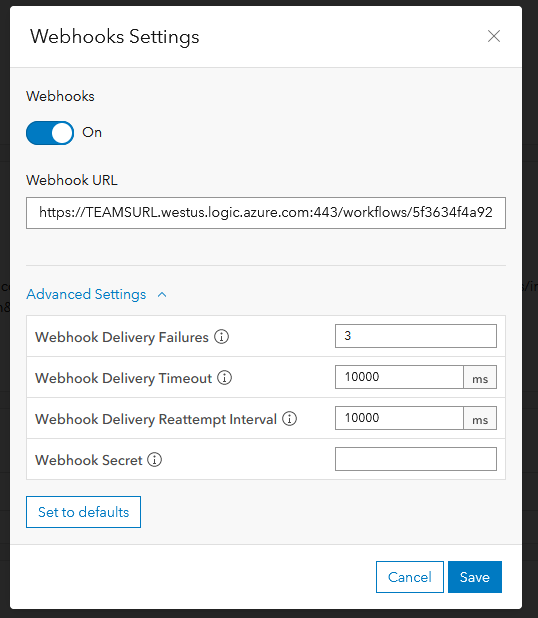
Next, we set up the webhook. This must happen in tandem with the Power Automate setup. Inside Power Automate we create a Flow and add in a Trigger for when an HTTP Request is received. Be sure to open Advanced Options and select Post for the method. Copy the HTTP Post URL from the Trigger. Then, go back to Monitor where you have created your webhook, and paste the Trigger URL into the Webhook URL parameter.
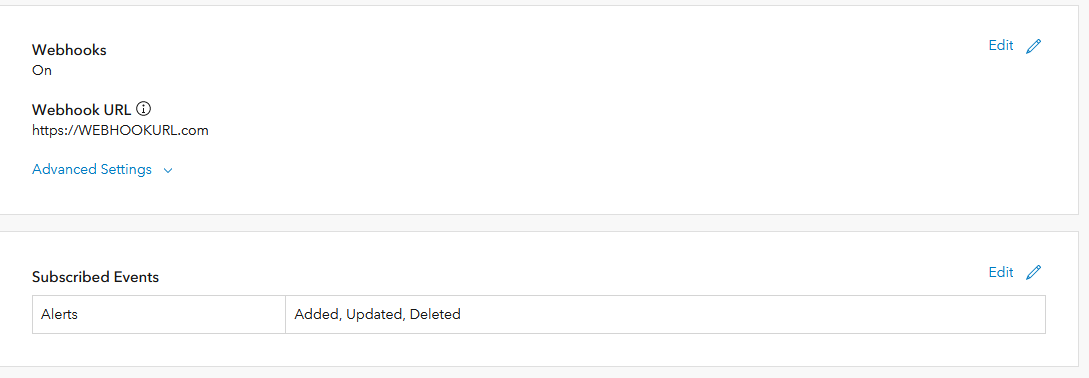
For this example, I am subscribing to the Added Alerts.
How Do You Customize the Alert Message in Power Automate?
The rest of the work is in Power Automate. The main task here is to customize the message we are delivering to the Teams channel.
Now that the Webhook Trigger is set up, we will iterate through the array of events that the Webhook payload contains. To do this you will add a For Each item to the Flow. Specify the events output from the previous step, which is the webhook Trigger.
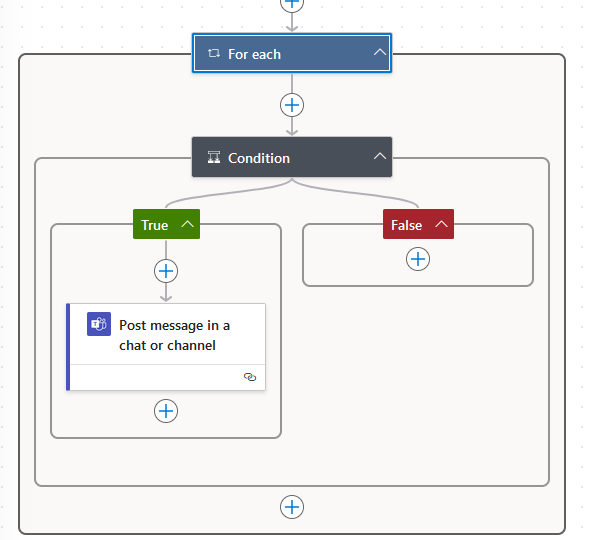
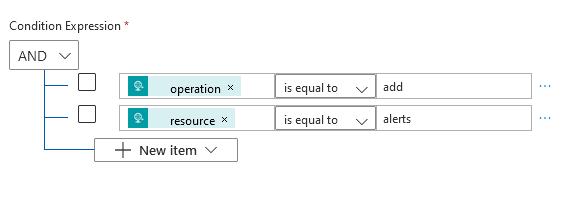
In this case, I only want to see the new alerts, so I added a condition. The condition checks that the operation from the event is equal to "add" and the resource is equal to "alerts". Now I am only processing new alerts!
The last step is the message we want to send to our users. Add the Teams item to Post messages in a chat or channel. Set up your Teams and the channel where you want to post the messages.
Now we need to consider the message.
First, we want to tell the user how to get to the alert. We need a link! The alert URL follows this format:
https://ARCGISMONITOR_URL/arcgis/monitor/alerts/ALERTID/overview
This is great because the attributes of the alert event contain the ID of the alert.
To make a link, we just have to substitute the ID into the URL.
https://ARCGISMONITOR_URL/arcgis/monitor/alerts/@{item()?['attributes']?['id']}/overview
Once the URL is created, copy it into the edit box of the message URL link for your chat or channel.
The rest of the message contains informational items. One piece of information I wanted to share was the reason for the alert.
This part is a little tricky and there may be an easier way to do it (please let me know if there is). The alert tells us the metric ID, which is an integer. There is not a way I can look this information up. To solve this I created a JSON look-up for all the metric IDs and the metric descriptions. I got this information from the backend PostgreSQL database, which is our setup at dymaptic for metric descriptions. That JSON was added to the Power Automate as a parse JSON variable.
Once I had the metric name, I was able to use the JSON look-up to make something more user-friendly. I took the metric ID and substituted the value in the parsed JSON variable like so:
body('Parse_JSON')?[string(item()?['attributes']?['metric_id'])]
As you can see, the Flow item is called Parse JSON.
The next item is to specify the condition, which I did using an If statement in Power Automate.
I used a status attribute of 2 or 3 to indicate a warning or critical. There are corresponding attributes for the warning and critical values, and we are making the connections with the if statement.
if(equals(2,item()?['attributes']?['status']),item()?['attributes']?['warning_threshold'],if(equals(3,item()?['attributes']?['status']),item()?['attributes']?['critical_threshold']))
It is a little messy, but it does work.
After the flow was saved and tested, I got a message. I was very happy to see a nice custom-formatted message for myself and the users.
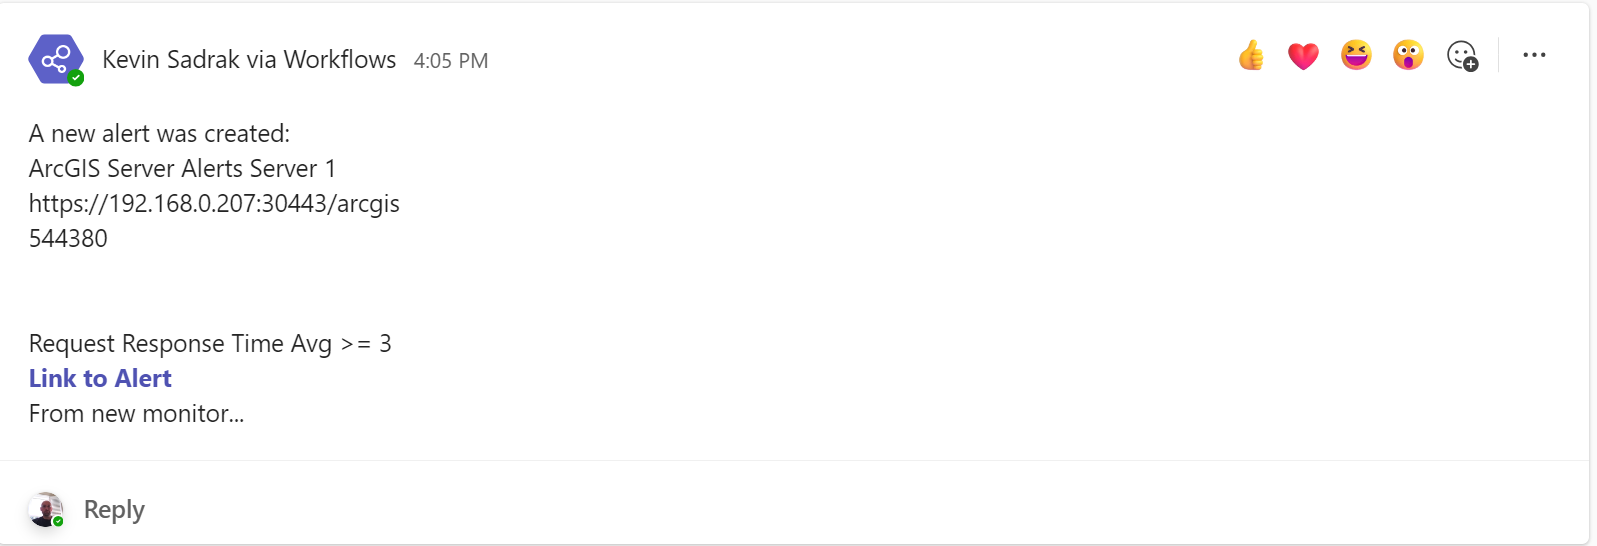
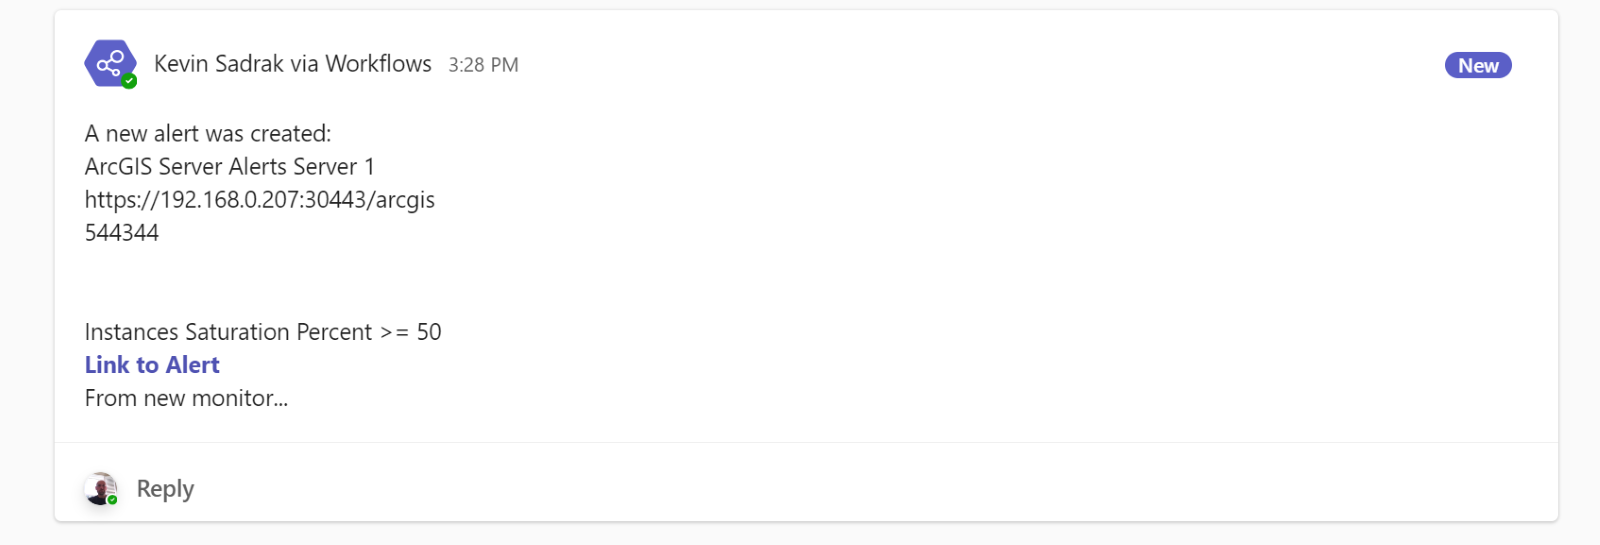
This workflow has helped the dymaptic team stay on top of server health without manual monitoring.
Have a Project in Mind?
The dymaptic team loves hearing about the different projects you are working on, brainstorming solutions with you, and sharing our technical expertise in the process.