Hexagons Are the Bestagons: A GIS Love Story
Why Hexagons Work for GIS Site Suitability Analysis
As any CGP Grey fan knows, hexagons are indeed the bestagons.
Watch: Hexagons are the Bestagons by CGP Grey (YouTube)
Here at dymaptic, hexagons are more than a visual preference. They're a practical tool for solving real-world GIS problems.
Quick Summary
- Hexagons offer a vector-based alternative to raster data for site suitability analysis in GIS.
- Unlike raster grids, hexagonal features support multiple attached attributes and dynamic symbolization using Arcade expressions.
- Dymaptic's GIS team uses hexagonal analysis for problems ranging from vacation site selection to solar and wind farm placement.
- Hexagons are not always the right tool; coordinate system limitations and large feature counts are key trade-offs to evaluate.
- This post walks through Site Suitability Analysis using hexagonal grids, illustrated with a fun and real-world vacation planning scenario.
Hexagonal grids offer a compelling alternative to traditional raster-based approaches for GIS site suitability analysis. While raster workflows are standard, they can become computationally expensive at scale. Hexagons, as vector features, allow analysts to attach multiple attributes, apply dynamic symbolization, and query data more efficiently.
What Is GIS Site Suitability Analysis?
Imagine you're like me, in the Pacific Northwest for those dark and rainy winter months, desperate for the perfect escape to a sunny vacation spot. While you might say "Christopher, just google (or ask Claude) for 'best beaches in winter,'" I say that as GIS nerds, we can do better.
Normally, site selection is an image-based workflow, relying on raster data. If you've never worked with raster data, you can think of it as a giant image, or a grid of pixels each containing bits of information like elevation, slope, temperature, precipitation, or sunshine hours. We can then do image processing to combine these together with different weights, for example. But when you have terabytes or petabytes of data, traditional raster processing can become computationally expensive and time-consuming. Sometimes you need a different approach that allows for faster queries and more flexible analysis. Enter our hexagonal heroes.
Why Are Hexagons Useful for GIS Analysis?
Hexagons are nature's favorite shape for a reason: they pack together perfectly, cover space efficiently, and all adjacent hexagons are exactly the same distance from each other.
They also offer some unique advantages to GIS analysis:
Pros:
- They're vector features, which means we can attach multiple attributes to each hexagon.
- We can use Arcade expressions to create dynamic, complex symbolization.
- They're great for aggregating data at different scales.
- They look way cooler than squares (sorry, squares).
Cons:
- When you cover a large area, you end up with a lot of features.
- Rendering can be slower than raster in some cases.
- Your colleagues might get tired of hearing you say "bestagons."
This list covers the most common trade-offs, but hexagons vs. rasters is a nuanced decision with many more factors worth exploring. Hexagons are a powerful tool, but they're not the only one in your GIS toolbox.
How Can Hexagons Be Applied to a Real-World Site Selection Problem?
Let's go back to my earlier vacation example. Instead of working with a bunch of big raster datasets of weather patterns, we can create a hexagonal grid where each hexagon contains attributes for:
- Average winter temperature
- Precipitation data
- Flight costs from PDX
- Number of beach access points
- Hotel prices
- Local cuisine ratings
Some of this data might be hard to get, like number of beach access points. Still, if we used the other attributes to narrow down our search space, we could use a deep learning package like TEXT SAM to attempt to extract beach access points automatically, but that's a different blog post.
From here, we could use Arcade expressions to create complex algorithms that consider all of these factors and dynamically update the symbolization. Warm hexagons with cheap flights and good food glow a bright yellow, while cold, expensive areas fade to blue. We could even add some custom sliders that allow us to dynamically adjust the weights of each variable to see what different areas of the country might look like! This is the kind of flexible, attribute-driven analysis that dymaptic's geospatial AI team builds for clients across industries.
When Are Hexagons Not the Right Tool?
Unfortunately for me and the other hexagon enthusiasts out there, a hexagon map for site selection is not always the right answer. Here are a few scenarios where they tend to shine:
- You need to frequently update or query multiple attributes (or dynamically change weights in the UI)
- Your source data is already vector-based
- You want to create complex, dynamic symbolization
- The final output needs to be web-friendly
- You're dealing with large raster or vector datasets that need to be simplified while maintaining analytical capabilities
On the other hand, hexagons are not the most ideal if:
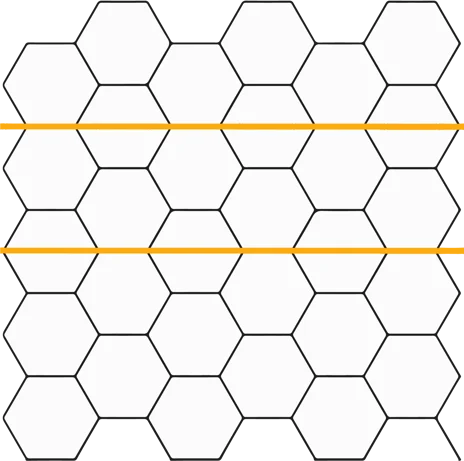
- Hexagons can obscure horizontal lines, because lines alternate between passing through the middle of a hexagon and running along the edge between two, making horizontal patterns harder to read.
- Hexagons cannot be addressed using a simple xy coordinate system and require a more complex addressing approach.
- Your data is already all in a grid. In this case, it might be better to simply use that existing grid.
- Most hexagons are mapped using a cylindrical coordinate system, which can distort shapes near the poles or across global datasets. Using smaller hexagons can reduce this effect but will increase the total feature count.
For more information on using hexagons for spatial analysis, check out the ArcGIS Pro documentation.
Whether you are planning a sunny winter escape, or expanding your company to a new location, hexagons offer a powerful alternative to traditional raster analysis, and one that dymaptic uses regularly across a range of client projects. They are not always the perfect solution, but when they work, they work beautifully. And hey, if nothing else, they'll make your map look fantastic. Because, let's face it, hexagons really are the bestagons.
Author's Note
This post (and some of the jokes) was written by myself, Christopher Moravec, with assistance from generative AI tools. For more on that writing process, visit my personal blog: christophermoravec.com.
Have a Project in Mind?
The dymaptic team loves hearing about the different projects you are working on, brainstorming solutions with you, and sharing our technical expertise in the process.